DVLP Studio
DVLP is a platform where pharmaceutical teams plan drug programs, assemble the evidence, and eventually trade the assets themselves. Across 2025 and 2026 I redesigned it end to end onto a lab-paper system: a warm bone canvas, a single oxidized orange, one grotesk doing all the talking. Nine surfaces of dense scientific data, made calm enough to work in all day.
- Role
- Design engineer
- Years
- 2025–26
- Stack
- Next.js · Tailwind · Design system
- Scope
- 9 product surfaces
02
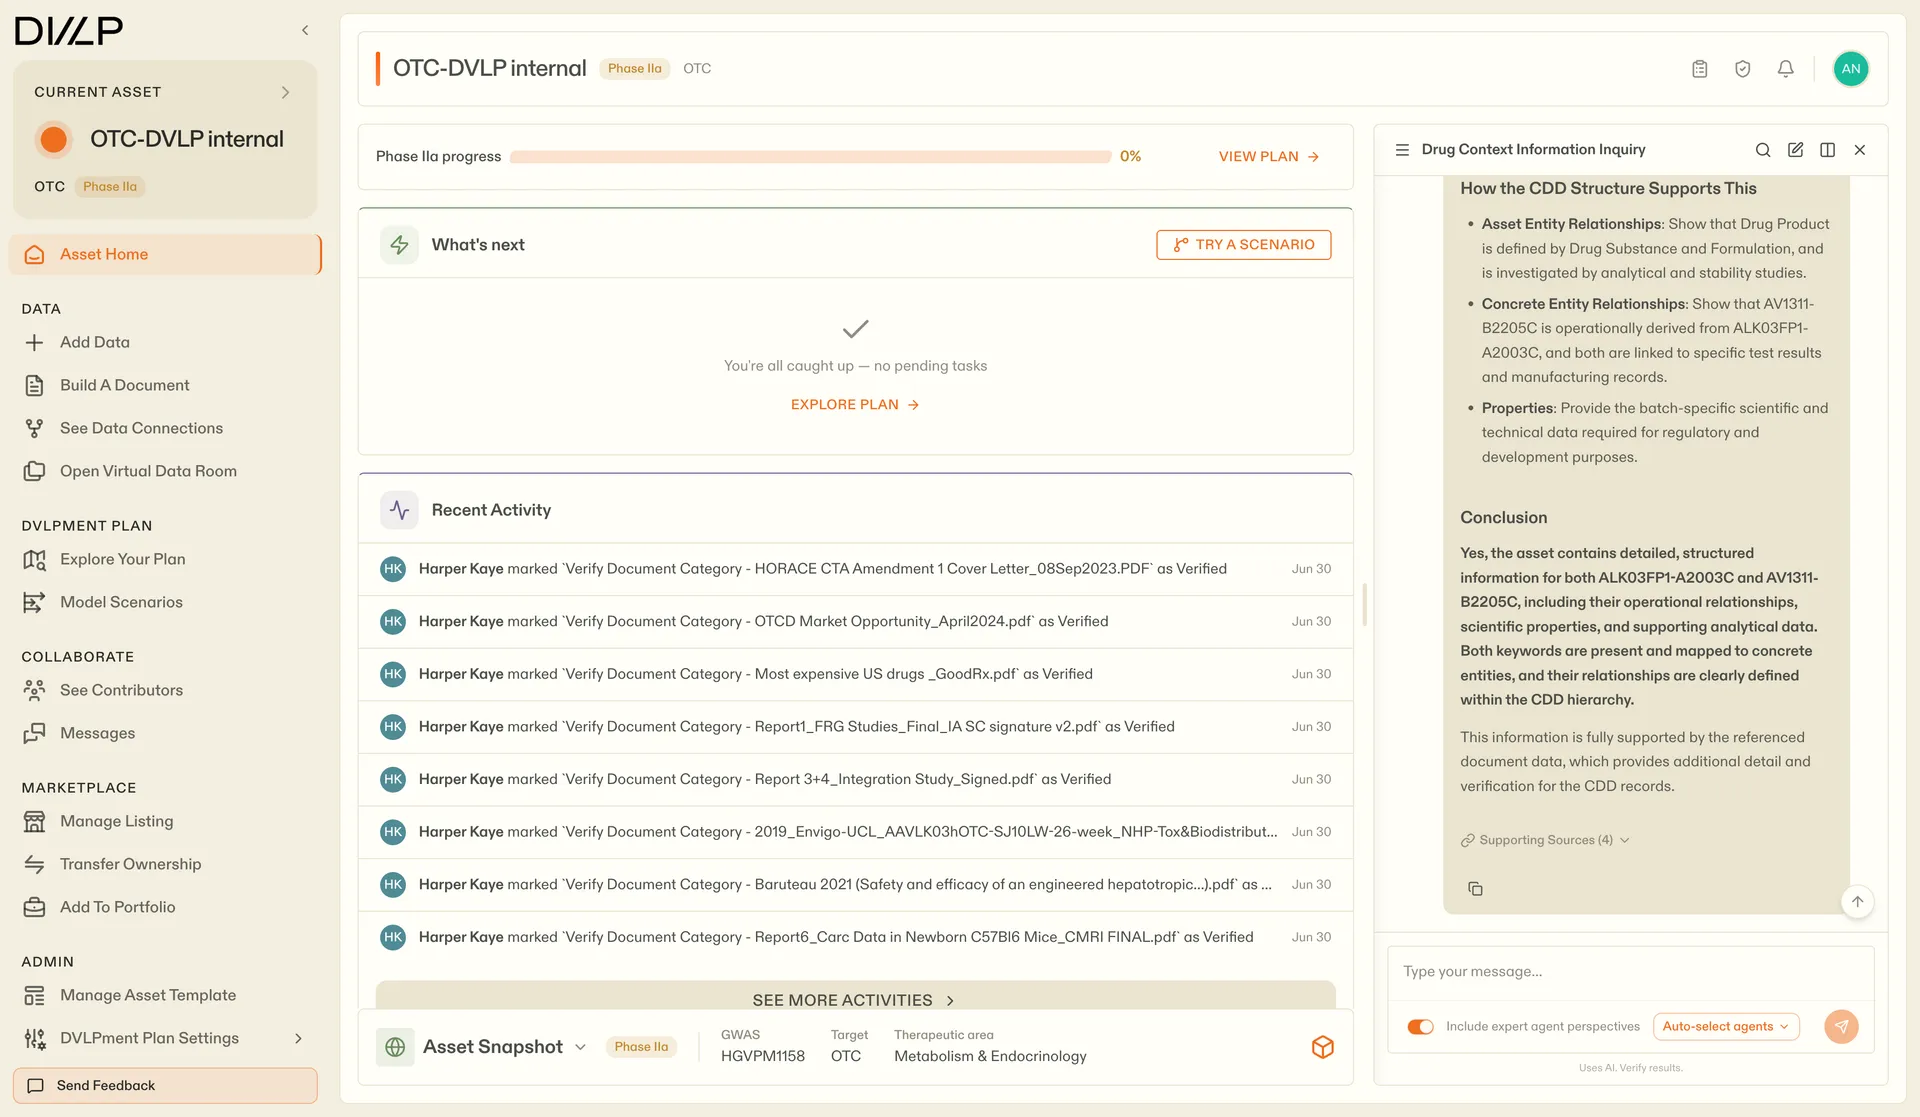
One surface for the science
Every asset gets a home that answers three questions the moment it loads: where the program stands, what needs attention next, and what changed while you were away. The AI panel sits alongside rather than in a separate chat product, because in this domain an answer without citations is worthless.
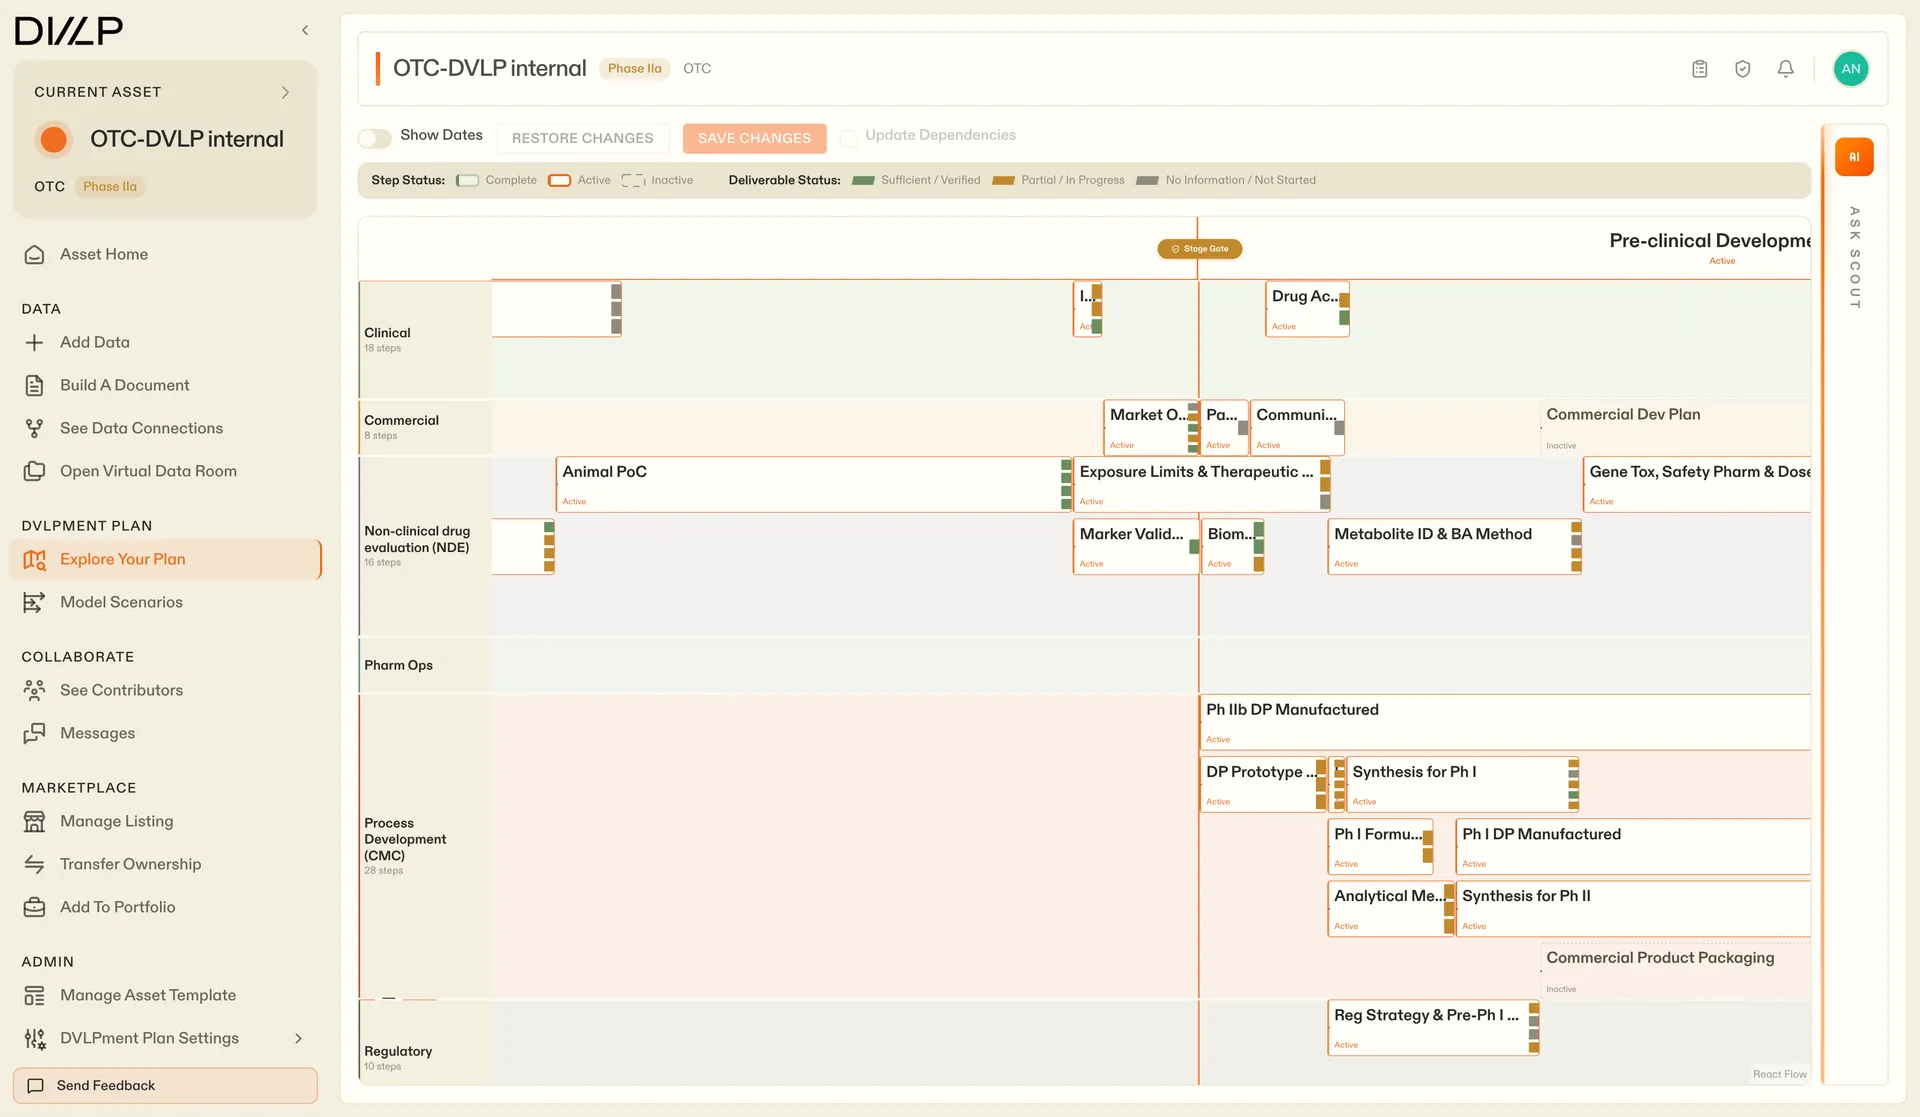
The development plan lives one click deeper. Clinical, commercial, non-clinical evaluation, pharm ops, CMC, and regulatory workstreams share a single board, cut by stage gates. Each deliverable carries its evidence status, so a program lead can spot the thin spots without opening a single document.
03
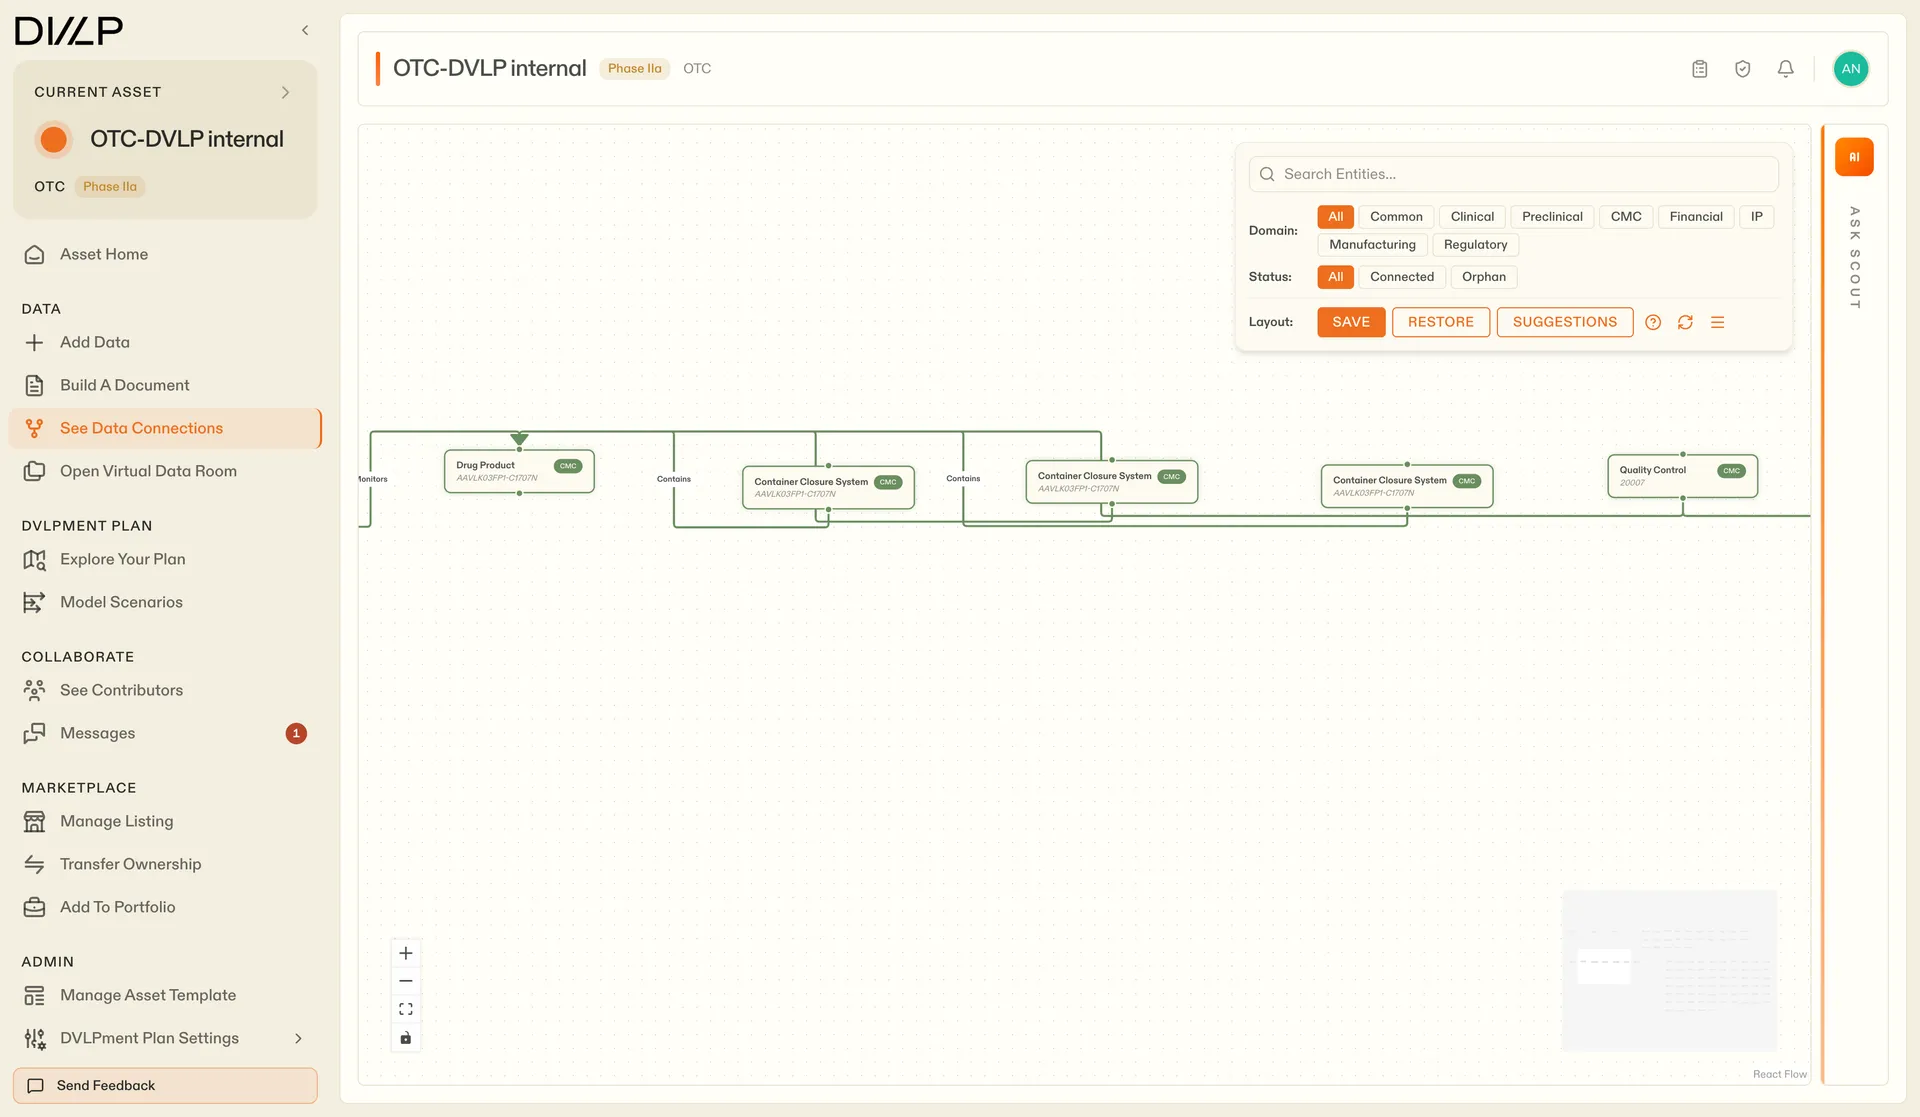
Data you can walk through
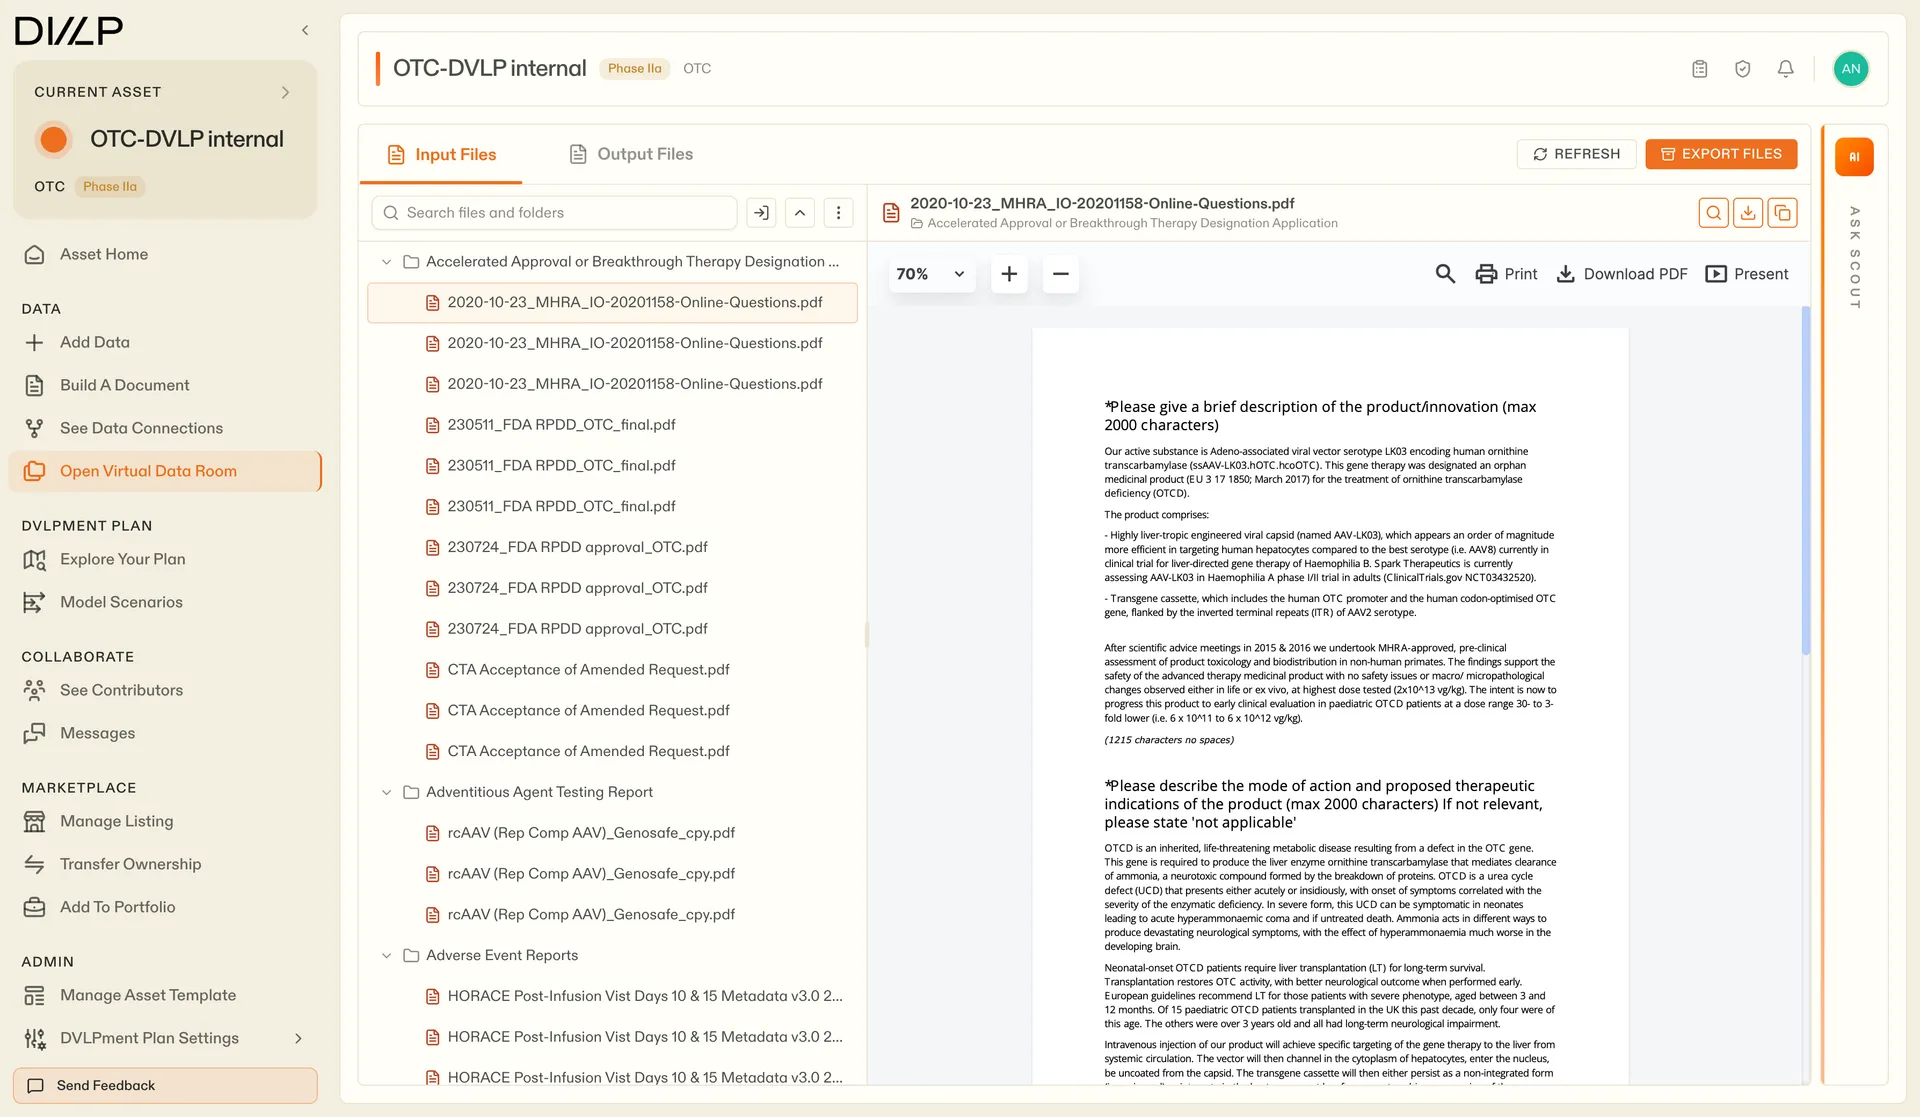
A drug asset is thousands of files and the entities they describe. I built two ways through it. The connections view draws the asset as a graph, drug product to container closure to quality control, filterable by domain. The data room keeps the regulatory sources in a plain file tree with the PDF open right beside it, so checking a citation never means leaving the platform.
04
Documents that draft themselves
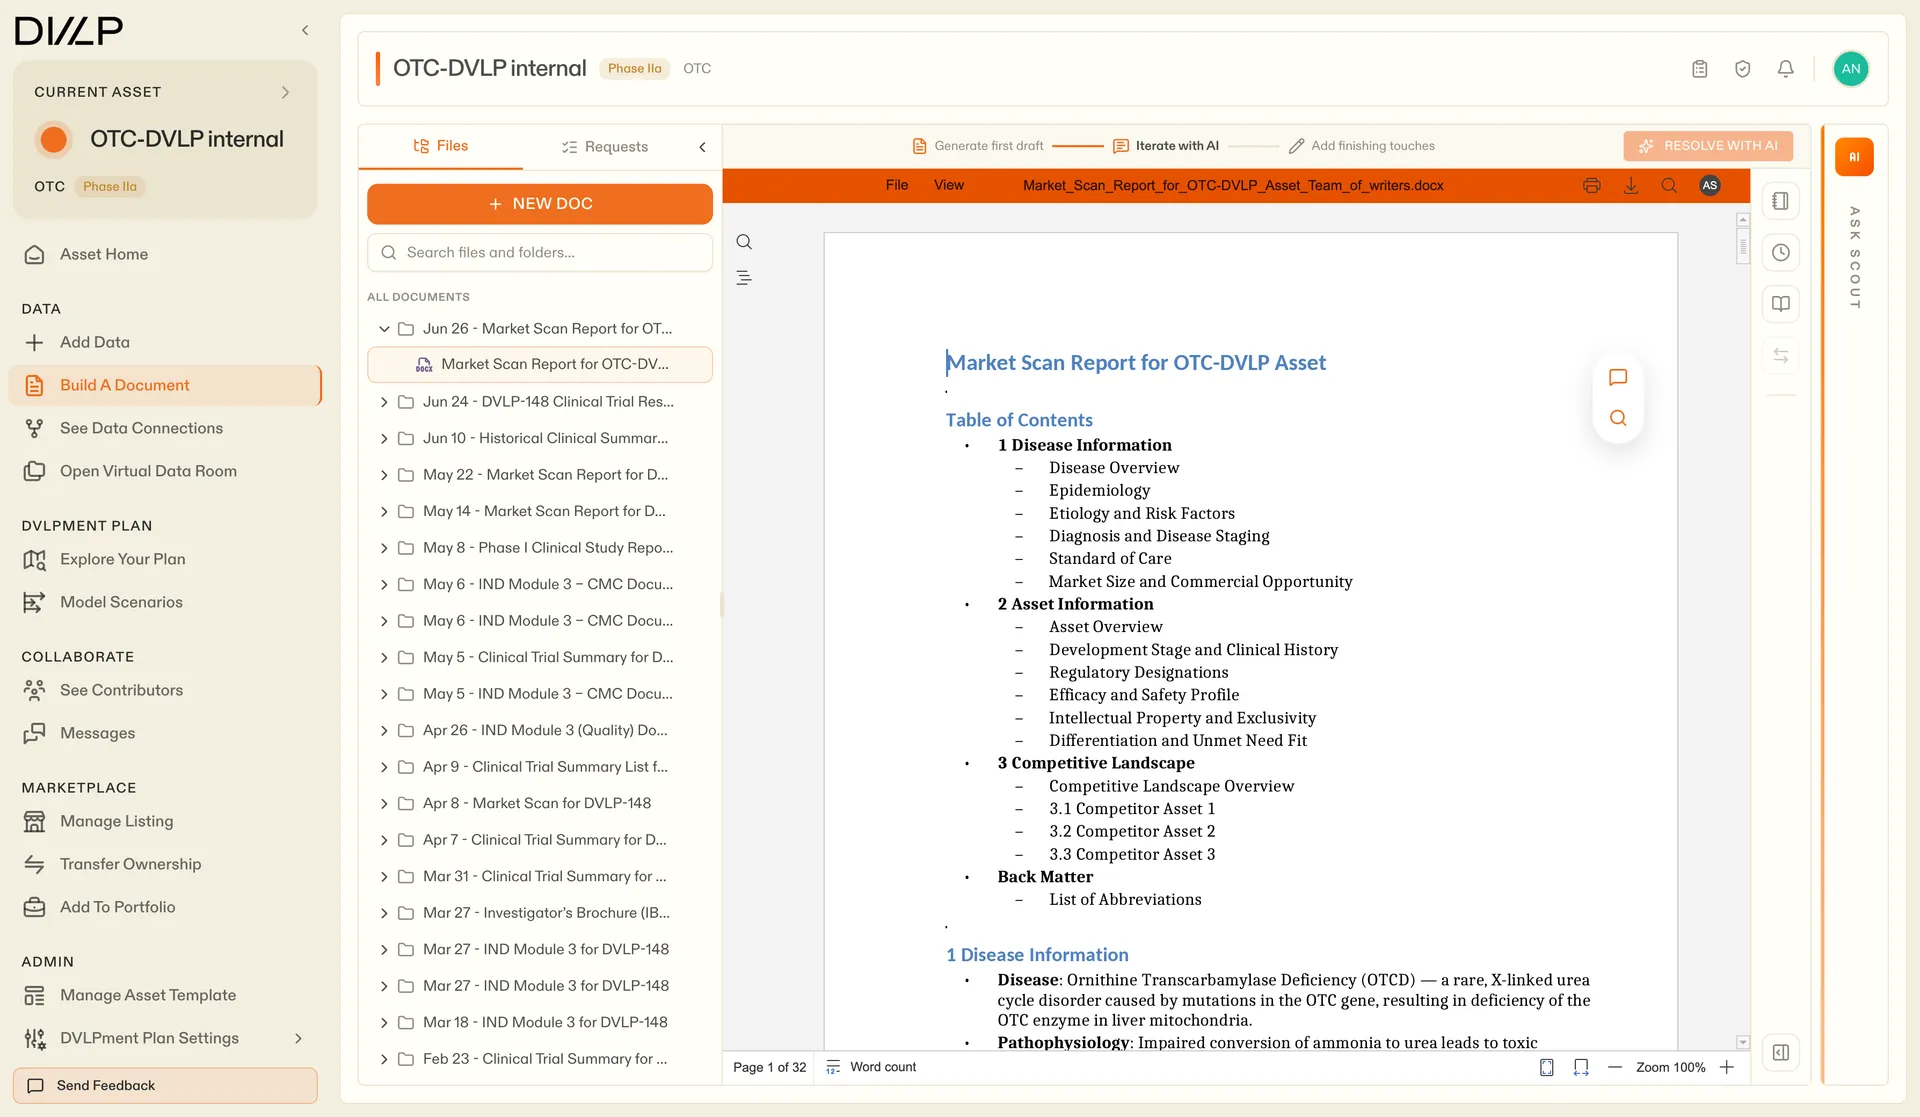
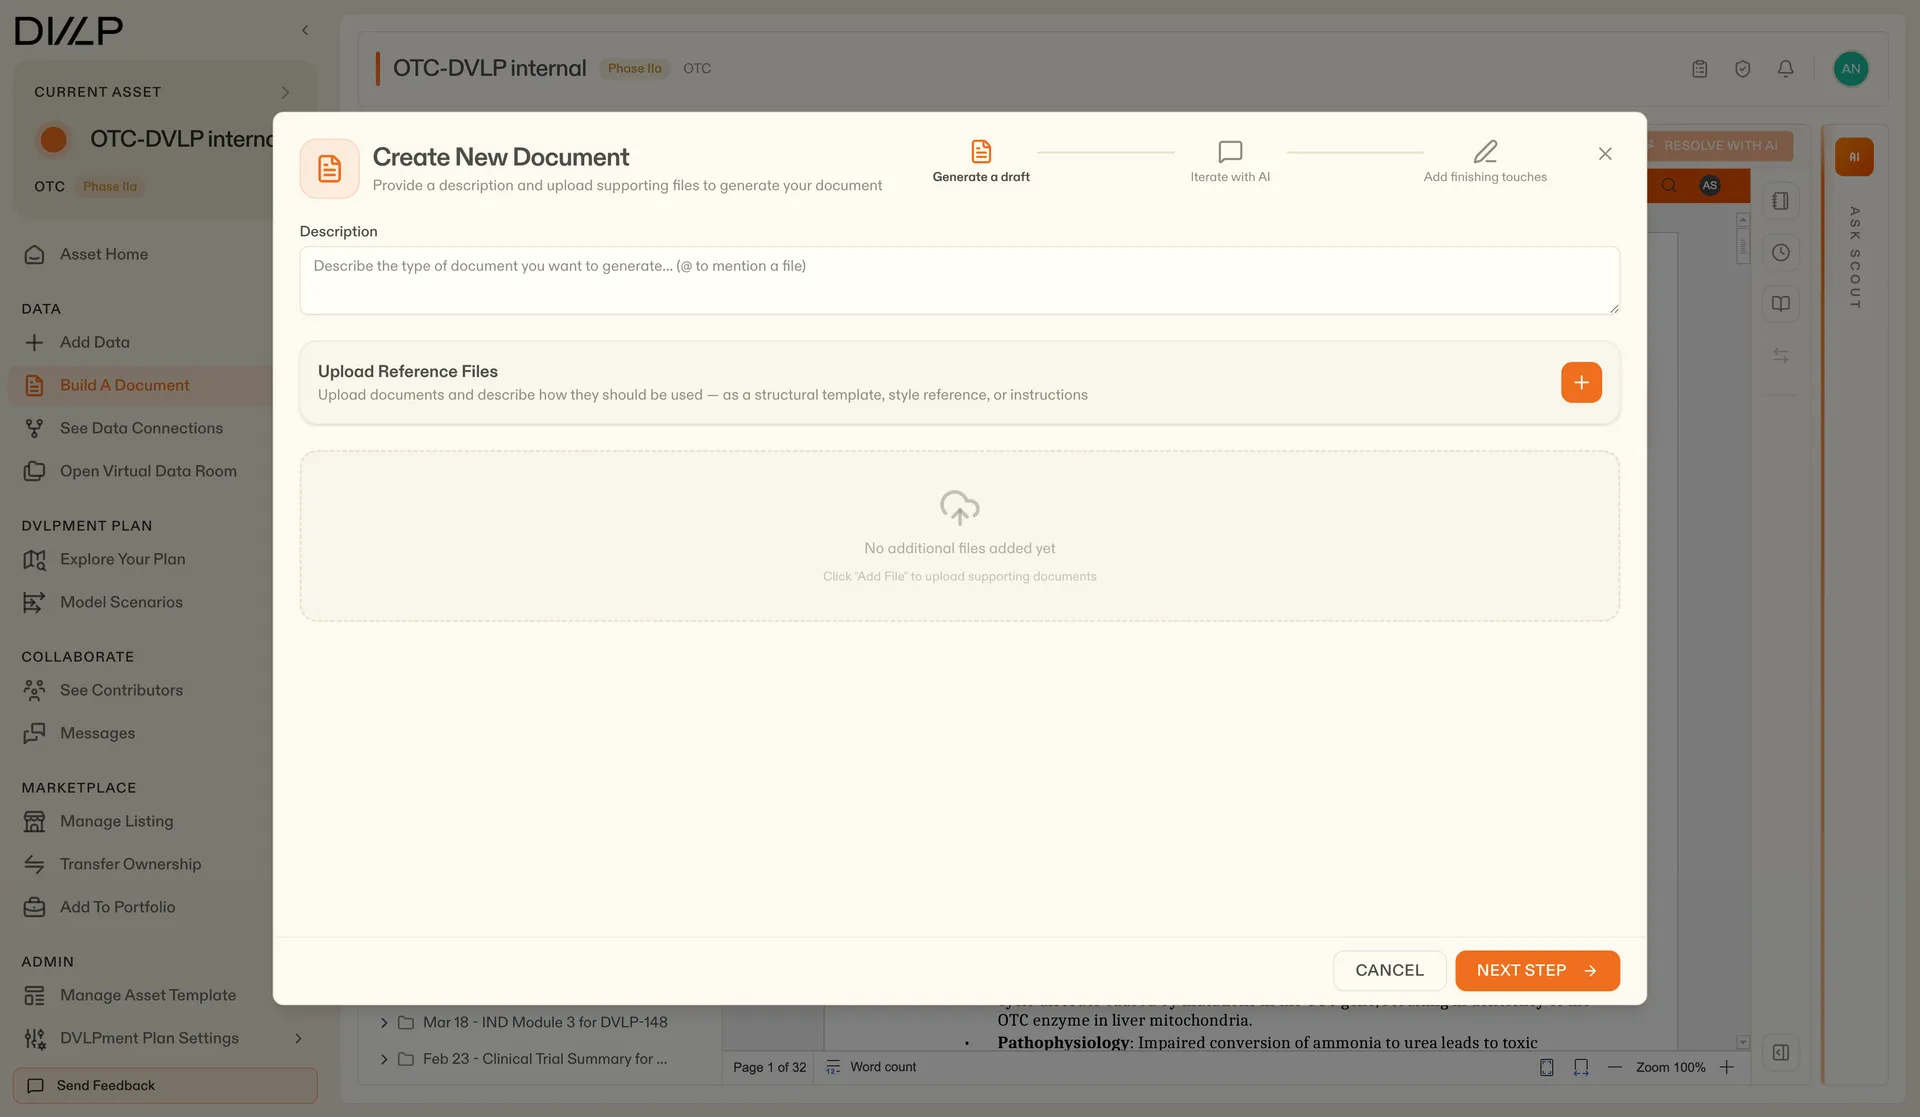
Regulatory and commercial documents are where drug programs lose their weeks. The document builder starts from the asset's own data, drafts the whole thing, and then walks the author through three honest stages: generate, iterate, finishing touches. The report shown here runs 32 pages. Starting one takes a description and whatever reference files you want it to lean on.
05
Trust built in
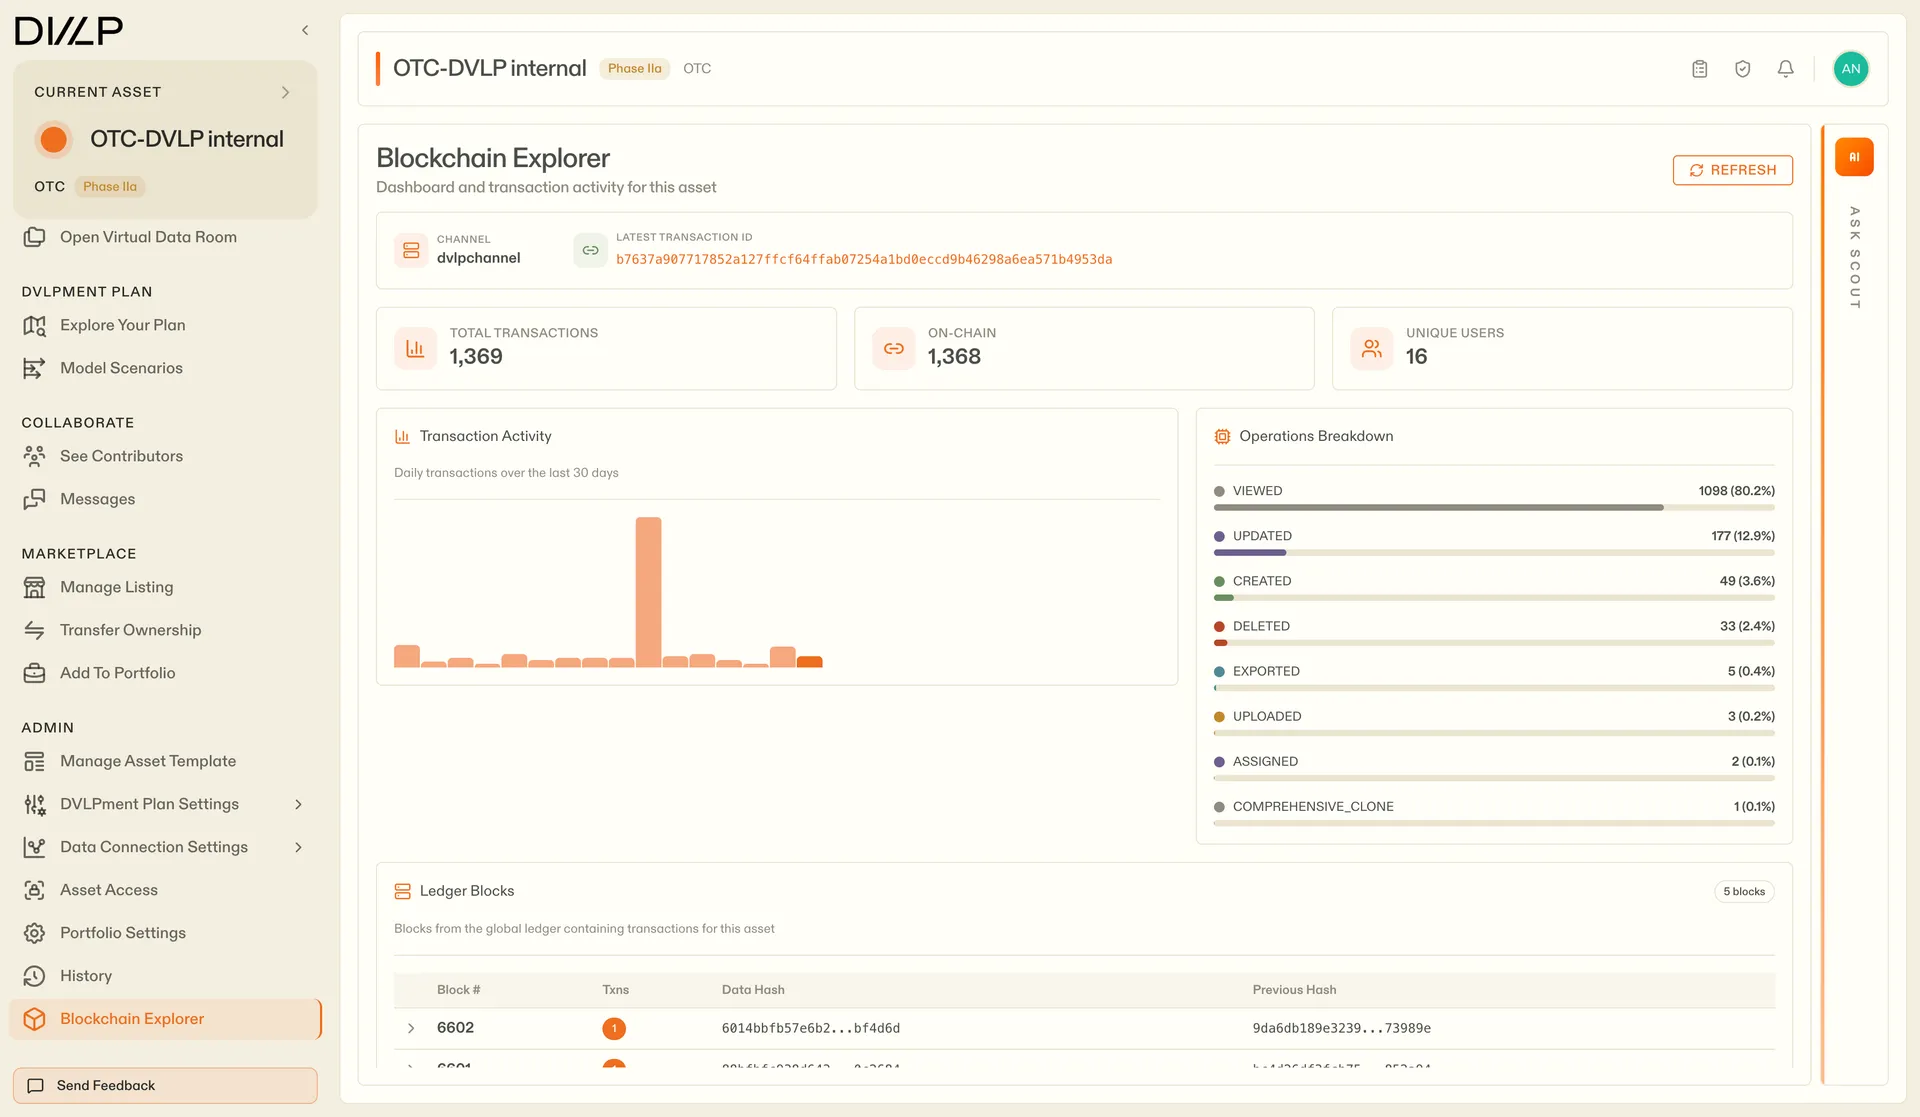
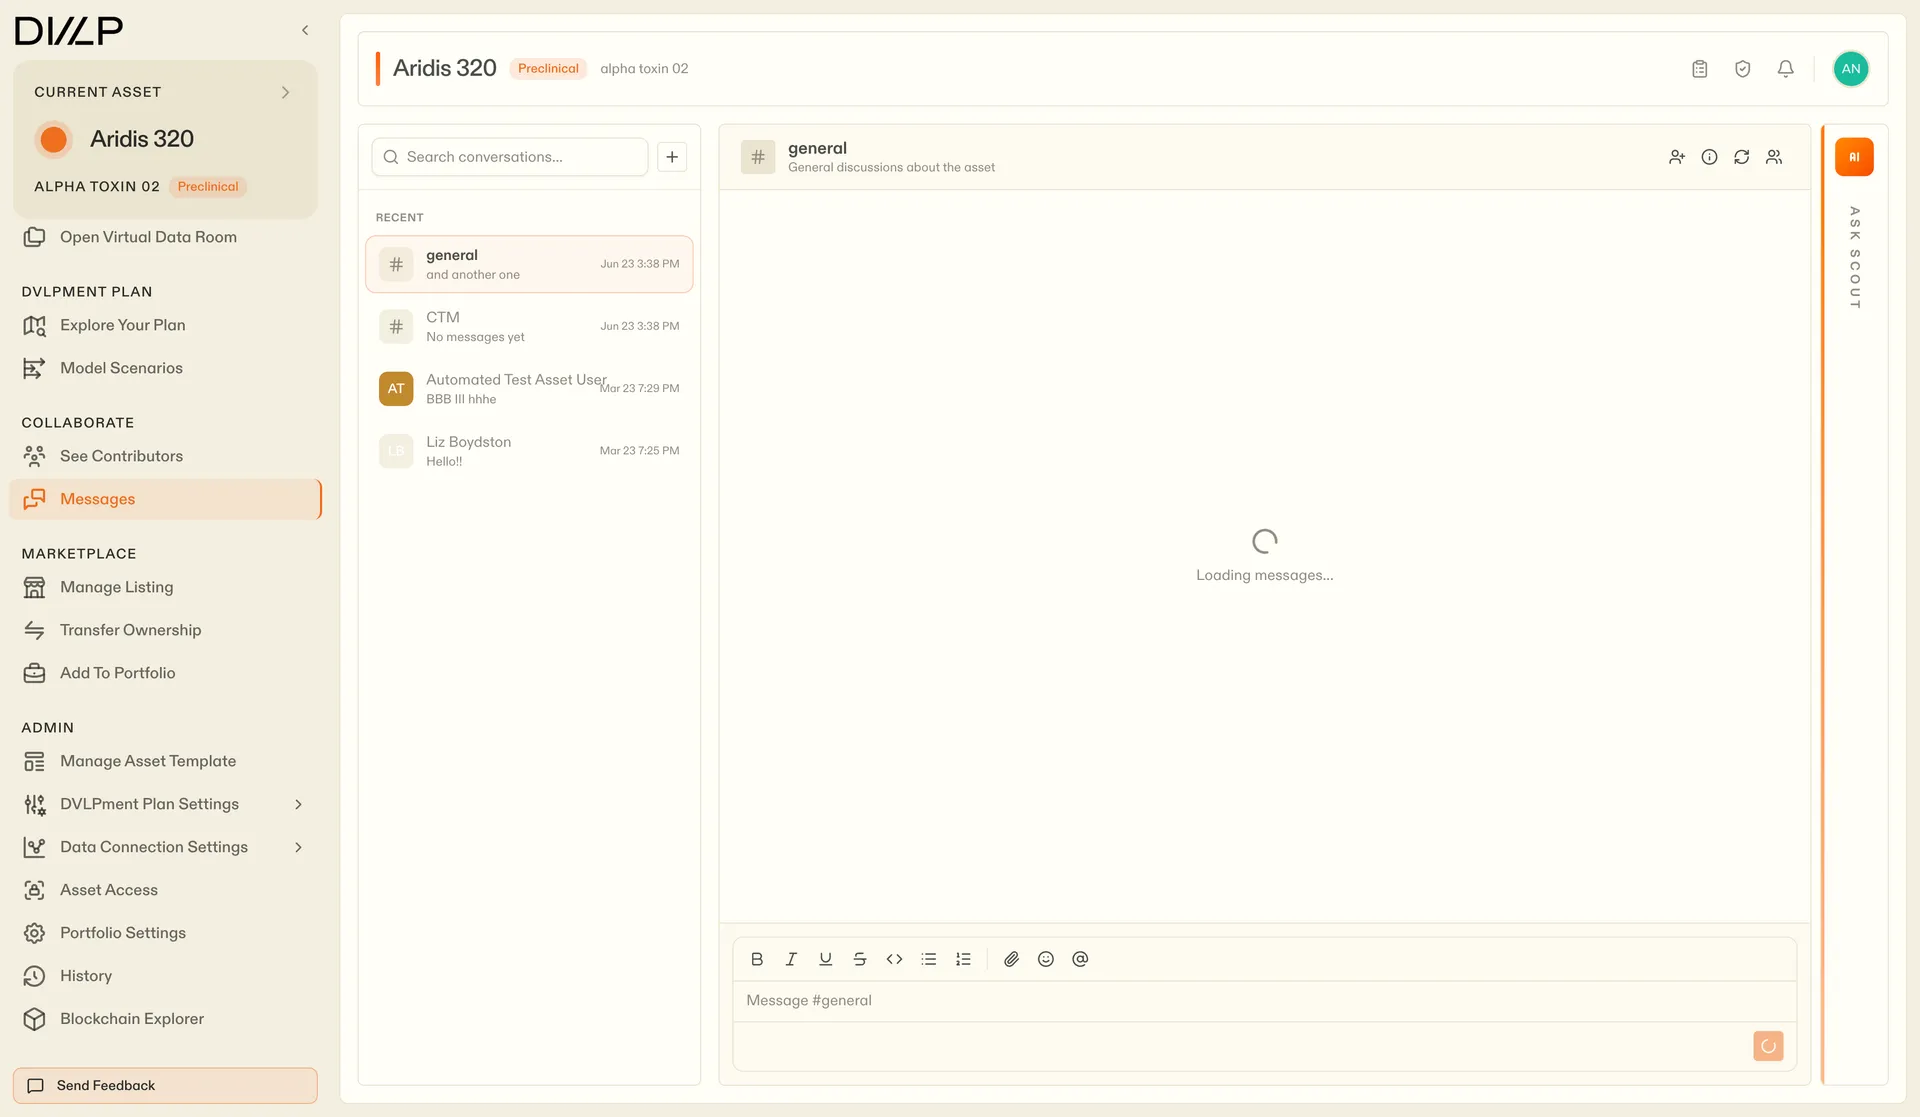
Drug assets change hands, and a buyer inherits the record along with the science. Every consequential action on the platform is committed to a ledger, and the explorer presents those blocks as plain accounting rather than cryptography theater. Conversation stays inside the same walls too: asset-scoped channels and direct messages, carried by Matrix, living next to the data they discuss.
06
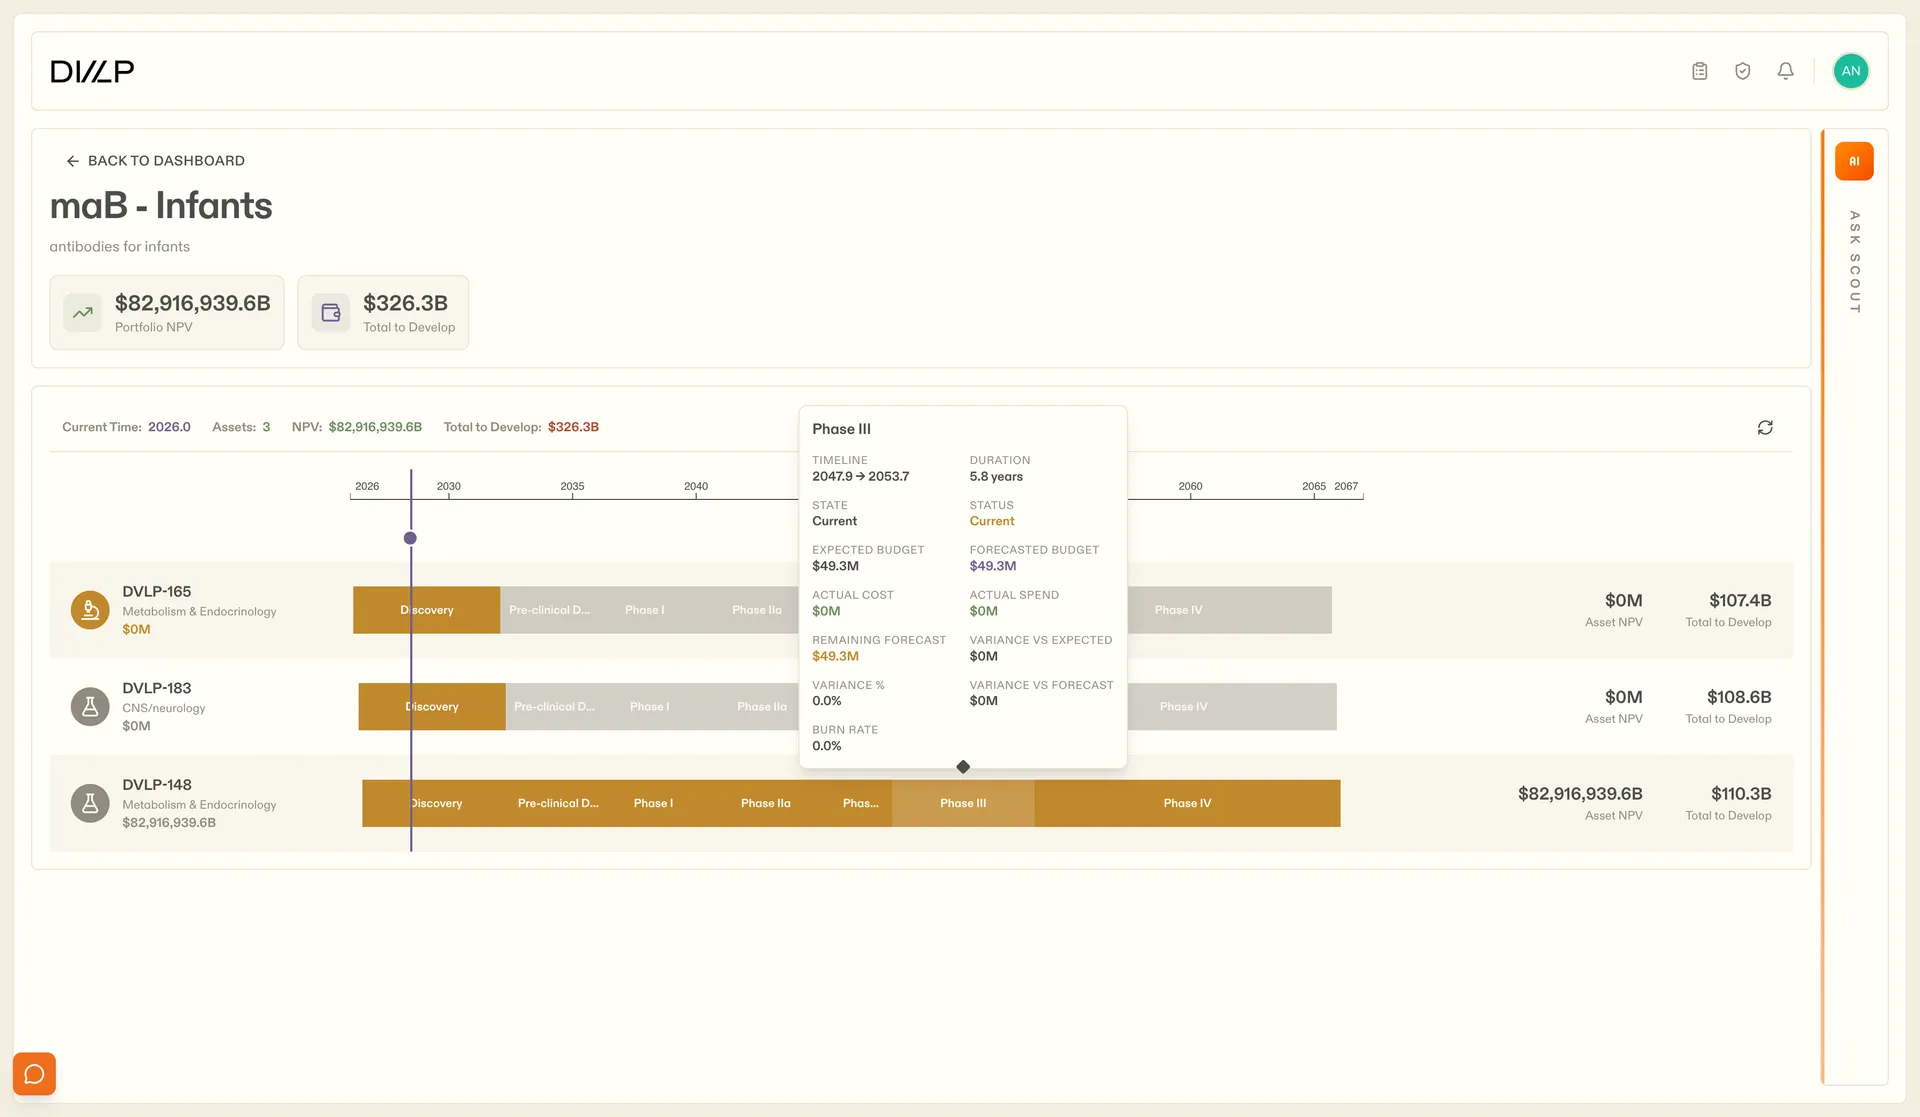
The whole portfolio at a glance
Leadership asks a different question: not how one program is doing, but what the whole pipeline is worth. Scenario modeling lays every asset on a single timeline that runs out to 2067, with net present value attached to each program. Drag a phase and the downstream numbers follow. It turns a spreadsheet argument into something you can point at.